Ellen Shapiro on Code Coverage

Source: Fabio Oliveira, Twitter

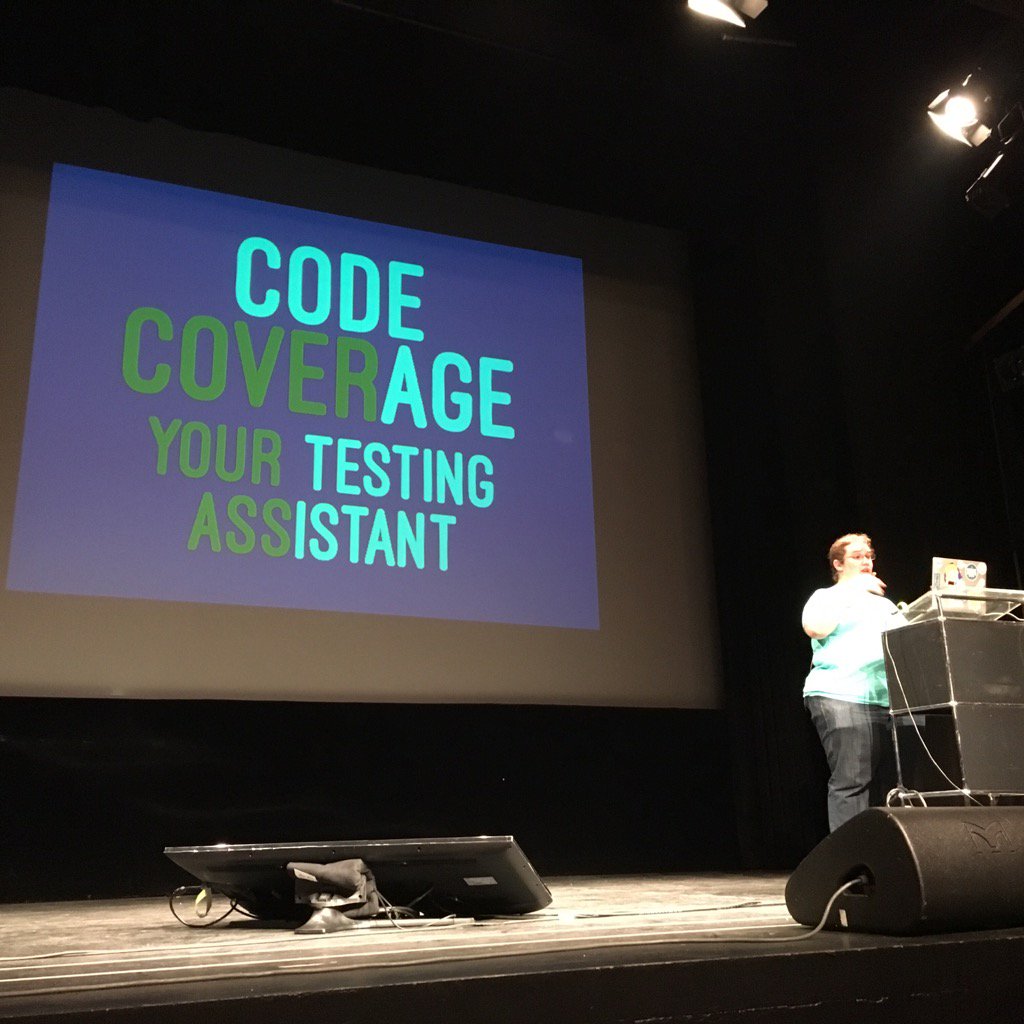
I caught this great picture on Twitter of Ellen Shapiro presenting at UIKonf last week in Berlin.

Now, I’m not totally sure of the topic of the talk, but having heard first hand of Ellen’s passion on automated testing, and seeing this slide, I’m pretty sure it’s content would be something that I would endorse here at cleanswifter.com.

If you aren’t following Ellen, you should be. I’ve seen her present several times, and she is my colleague on the raywenderlich.com iOS team. Besides Twitter, here’s an appearance of her’s on the raywenderlich.com podcast that you’ll enjoy.

I’ll even leave you with a fun story from the first time that I met her. This was back at a CocoaConf in the fall of 2014 in Boston. During an impromptu lunch time session where developers could show off their own apps, Ellen stepped up to give a demo of Hum. It’s an app for musicians to help record little bits of audio so they can remember it later, for use when you’re songwriting. A major part of the app has to do with recording audio so you can listen to it later. Ellen blew people away in the demo by belting out, herself, solo and acapella, the opening line to Black Dog by Led Zeppelin. I think I speak on behalf of the whole room, that I was blown away by its awesomeness. I was a fan for life, and that’s before I came to learn about her passion for high quality iOS code.

If you ever get to meet Ellen, tell her the Clean Swifter says Hi.

Happy cleaning.

PS – Thirsting for a tutorial? I’ve got something good planned for tomorrow- how to run your first XCTest on Amazon Device Farm. Be sure to come back and check it out.

Separate Schemes For Better iOS Code Coverage

As you continue to construct the test pyramid for your iOS apps to Martin Fowler’s specification, you’ll find the desire to separately measure your code coverage for both unit tests and functional tests. And if you don’t have that desire, then you should know that measuring a combined code coverage for both unit and functional tests is not an accurate representation of how your production code is truly covered. For one, functional tests will generally have a higher coverage, while also including less assertions. This is because of how much code gets executed while broadly navigating through your app as functional testing does. This data will then be glom’d on to the code coverage metrics for your unit tests, making it really hard to identify where you can refine the coverage of your unit tests. And the opposite can also be true, where you have unit test coverage and no functional test coverage, but since you are only evaluating a single number, you can’t figure out where one ends and one begins. To fix this, use separate schemes for better iOS code coverage. By moving each group of tests into their own scheme, you’ll be able to measure code coverage independently.

The Fix – Separate Schemes

To fix this, you are going to create separate schemes for better iOS code coverage. To start, you are going to duplicate the main scheme for your app, and then specify a different set of tests for each scheme. I’ll walk you through creating a separate scheme for your unit and functional tests. For this example, we’ll be using KIF as the tool for the functional tests (Yes, soon enough I’m going to take a deep dive into Xcode’s new UI tests). For this walkthrough, you’re going to continue with the project from Wednesday where you setup code coverage for unit tests. You can find the project on GitHub if you just want to start there. https://github.com/obuseme/CodeCoverage.

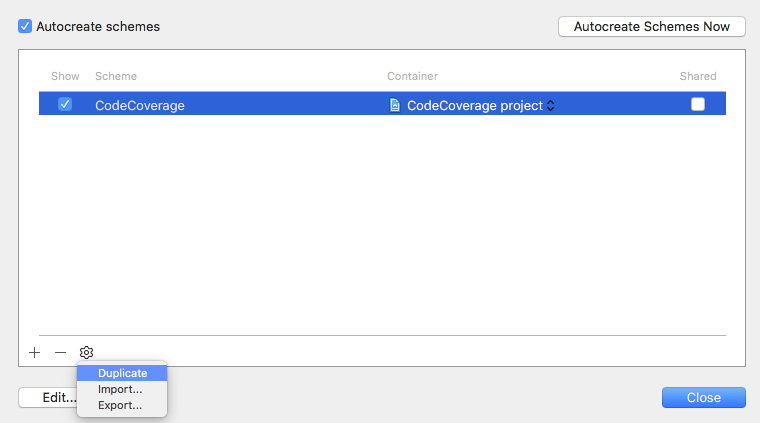
To start, open the Scheme Editor and duplicate the one and only scheme.

Separate Schemes For Better IOS Code Coverage

The new, duplicate, scheme that you created will be used for executing your functional tests, while the initial scheme will be used for your unit tests. The benefit of this is that you’ll be able to separately calculate code coverage for each set of tests. The drawback is that you’ll need to manually switch the scheme to execute each set of tests.

After you’ve duplicated the scheme, rename the new scheme to CodeCoverageFunctionalTests.

Next, create a new “iOS Unit Testing Bundle” target named CodeCoverageFunctionalTests. This target will contain your KIF tests.

Next, install KIF, preferably with CocoaPods. For detailed instructions on doing this, follow my previous post here. Ensure that the target you specify for where KIF should be installed is CodeCoverageFunctionalTests. And of course, after first configuring CocoaPods with a project, after you install pods for the first time, close CodeCoverage.xcodeproj and open CodeCoverage.xcworkspace instead.

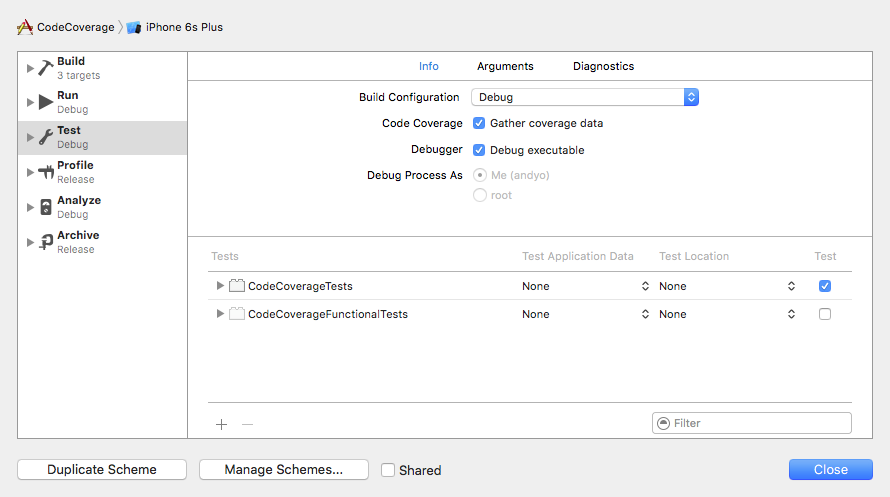
And for the final step, edit each scheme to selectively use one of the two test targets for its Test step. First, edit the scheme for CodeCoverage and set the test suite for the Test step to be CodeCoverage. Make sure Gather code coverage is selected as well in each scheme.

Separate Schemes For Better IOS Code Coverage

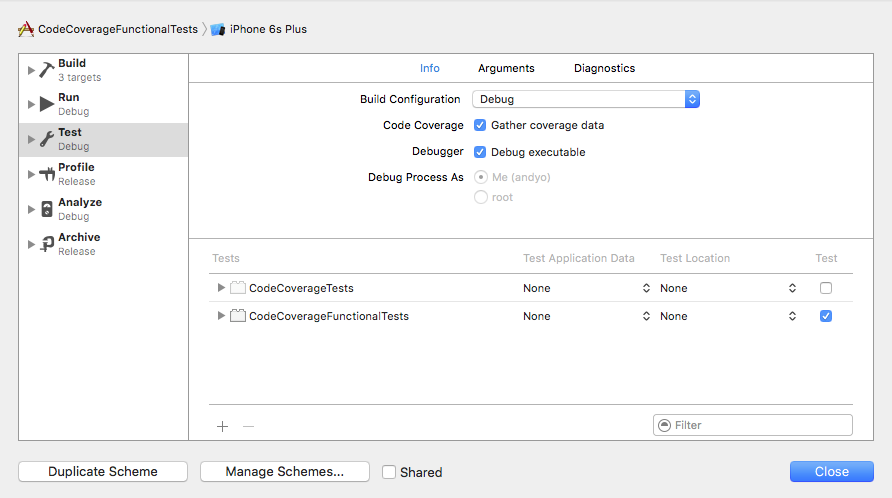
Then, edit the scheme for CodeCoverageFunctionalTests and set the test suite for the Test step to be CodeCoverageFunctionalTests.

Separate Schemes For Better IOS Code Coverage

BOOM! That’s it. Now you can explicitly change schemes, and use Command-u to run tests for each scheme. Depending on the scheme selected, a different set of tests will be run – either the unit tests or the functional tests, and as a result, different code coverage metrics will be generated.

Wrap Up

This post concludes a week of code coverage information. I hope you enjoyed it, and I hope your tests are better covered as a result separate schemes for better iOS code coverage. I’d love to hear how you’re using code coverage. Please post a comment and let me know!

Happy cleaning!

Broken Code Coverage in Xcode: How To Fix It

When using metrics to make decisions about your code, it’s fundamentally important that those metrics are 100% correct. You need to have absolute faith in the reported numbers. If this is not the case, you risk making decisions and taking action through inaccurate data, and risk making incorrect decisions. By default, there’s a critical flaw in how code coverage is measured by Xcode for iOS apps. From the moment you setup unit tests for a project, Xcode will automatically identify code as “covered” for anything that is triggered through the normal application launch sequence, such as your application delegate. This means that your code coverage numbers will be artificially inflated! And broken code coverage in Xcode means you won’t fully understand how well your app is tested.

Let me say this one more time to it sinks in, your iOS code coverage numbers are not correct unless you take specific action to fix them.

An Example Of Broken Code Coverage in Xcode

First, I’m going to demonstrate to you the broken-ness of code coverage in Xcode. Then, I’m going to show you how to fix it.

To observe the broken code coverage, you are going to perform these steps:

1) Create a new empty project, including unit tests 2) Leave the unit tests empty 3) Turn on code coverage 4) Run the tests, and review coverage

Let’s do it. First, create a new Swift iOS project called CodeCoverage. Be sure to check Include Unit Tests.
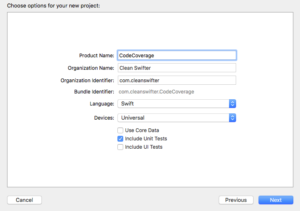
broken code coverage in xcode

Open CodeCoverageTests.swift. You aren’t going to make any changes to this file, but notice how there are two empty test implementations testExample() and testPerformanceExample(). These tests will run and pass, but should generate 0% coverage of the application.

Now, turn on Code Coverage. Open the Scheme Editor and check Gather coverage data.
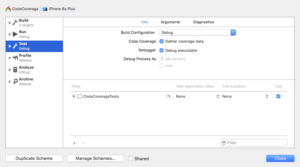
broken code coverage in xcode

Finally, run the tests. Command-U (you only get a keyboard shortcut today :). Open the Code Coverage results from the Report Navigator.

broken code coverage in xcode

Uhhh, what’s wrong with that picture? It should be obvious, code coverage is being shown for ViewController and AppDelegate despite there being absolutely no legitimate tests in the project.

Why There Is Broken Code Coverage in Xcode

Well, I wouldn’t blame it all on Xcode. Xcode is measuring the code that is executing when your tests execute. And technically, since you app is starting up and showing the first view controller, that code has executed, so it’s reported as covered. The thing is, by the definition of how you want to measure code coverage, that code isn’t actually “covered.” There’s a really easy way to correct this.

How To Fix Broken Code Coverage in Xcode

Jon Reid’s article on How to Switch Your App Delegate for Fast Tests inspired me to figure out how to fix this. You are going to create a separate app delegate that is used by your tests. This app delegate will be entirely empty, so it totally intercepts the app launch sequence. This way, no code in your real app delegate will be executed unless explicitly done so from a test, and ditto for any view controller that it would have otherwise instantiated.

Note: I want to give full attribution to Jon Reid on this code. I just figured out that it also fixes broken code coverage in Xcode.

To fix this, first open AppDelegate.swift and delete this line:

@UIApplicationMain

Create a new Swift file named TestingAppDelegate.swift, and replace it’s contents with:

import UIKit

class TestingAppDelegate: UIResponder {
}

This is the meat of the fix. It’s an empty implementation of an app delegate that will be used rather than your “real” app delegate.

Create a new Swift file named main.swift, and replace its contents with:

import UIKit

let isRunningTests = NSClassFromString("XCTestCase") != nil
let appDelegateClass : AnyClass = isRunningTests ? TestingAppDelegate.self : AppDelegate.self
UIApplicationMain(Process.argc, Process.unsafeArgv, nil, NSStringFromClass(appDelegateClass))

This is the first code that executes on app launch. It first checks whether XCTestCase is an available class to determine whether the app is being launched from tests or not. Depending on the result, a decision is made as to which app delegate should be used – the real one, or the empty one.

That’s it. Now re-run your tests and open your coverage report.

Note: You may need to Clean for a successful build.
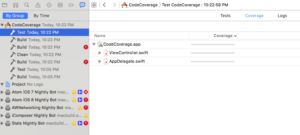
broken code coverage in xcode

Woohoo! 0% coverage. Ya, that’s the only time you’ll ever be happy about 0% coverage, but in our case, we have no legitimate tests, so it’s what we want! Yay, we fixed our code coverage.

Side Benefit: Faster Tests

A side benefit of this fix for correcting broken code coverage in Xcode is that your tests will run faster. By alleviating the simulator of bootstrapping a significant portion of app startup, you’ll save that time each test run. I just compared the before state and after state of this fix on one of my current projects where we have about 500 unit tests. Before the fix, the tests ran in 21 seconds. After the fix the tests ran in 19 seconds. That’s about a 5% speed increase. Multiple 2 seconds over the large number of times that the tests will be run, and that’s a lot of time.

Looking forward

I added the final project to GitHub at https://github.com/obuseme/CodeCoverage. I hope that you find use in this approach. Just remember, you want 100% confidence in your code metrics. For me, if I notice something wrong with one of my code metrics, I stop using it until I get to the bottom of the false data.

Tomorrow, I want to show you how you can gather separate code coverage metrics for your different types of tests. Hint, it involves some crafty Scheme creation.

Happy cleaning.

Swift Code Coverage: How to measure it

Yesterday, I talked about the merits of how code coverage can be used as a metric in your software development process. Measuring Swift code coverage in Xcode has never been easier. Apple provides a great overview in their WWDC 2015 session, “Continuous Integration and Code Coverage in Xcode”. Xcode 7 provides a integrated experience for tracking the coverage of your tests. You can literally start measuring the code coverage of your tests by clicking a single checkbox. And good news, the coverage also works for your KIF tests.

How To Turn On Code Coverage Measurement

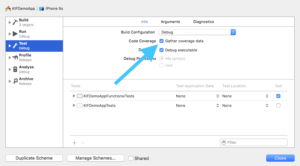
Open your scheme editor by selecting Product -> Scheme -> Edit Scheme, or the keyboard shortcut Command-Shift-Comma.

Select Test in the left hand pane, and then check the box for Gather code coverage.

swift code coverage

That’s it! On your next test run, Xcode will measure the Swift code coverage of your tests.

Viewing Swift Code Coverage Results

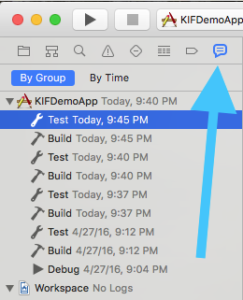
Viewing the results of how your tests fare with code coverage is just as easy. Run your tests, and then open the Report Navigator. You can open this by either selecting the thing that looks like a chat bubble in the left hand pane of Xcode, or select the menu Product->Scheme->Edit Scheme…, or use the keyboard shortcut Command-8. Then select your most recent Test run in the list.

swift code coverage

From there, in the center pane of Xcode, look for the Coverage tab.

swift code coverage

On the Coverage tab, you’ll see a list of your classes, and their methods, with bar charts indicating how much of their code is covered from your tests.

You can then even jump right to the corresponding code from the coverage viewer. Just double click either the class or method name. And what’s even cooler, is that Xcode will show you the number of times the line of code was executed in the right hand gutter of the editor.

Overlapping Test Types

Keep in mind, that depending on how your test targets are configured in the scheme, that the results you are looking at may be an aggregate of more than one type of test. For example, if you’ve created both unit and UI tests, and they each live in their own targets, but both targets are included in the Test action for the scheme, that the coverage numbers will be an aggregate of both types of tests. I’ll write a post later this week with a proposal on how you can separate these metrics (hint: it involves creating separate schemes for each type of tests).

Wrap Up

Measuring your Swift code coverage really is that easy. Normally code coverage is also tracked in actual numbers, and reviewed for trends over time. With Xcode alone, it doesn’t provide this. Xcode Server helps remediate the problem while providing specific measurement numbers and also allowing you to compare coverage numbers across different devices. Have fun with code coverage. When working in a team, it’s fun to watch code coverage change over time, hopefully for the better. I suggest that even as you code review your peers’ work, peak at how the code coverage for a given piece of code changes with their change. Does it go up? Does it go down? Remember, code coverage is just a metric that indicates whether a line of code was executed or not. It doesn’t speak at all to the quality of the test. Please be a professional, and professionals don’t write code without using test driven development.

Happy cleaning.

Code Coverage Is A Silver Bullet

Have you ever measured code coverage on any of your projects? How did it work out for you? What problems did it solve? Did it present any new problems? Code coverage is a silver bullet, a silver bullet for understanding how well your tests cover your code. Beyond that, it’s really what you make of it.

What Is Code Coverage

Code coverage is a metric that measures how much of your “production” codebase is being tested by your automated tests, usually unit tests. It’s usually measured at the granularity of a line of code, and sometimes measures methods and classes in aggregate. It’s nothing more than a black and white measurement, how much production code was executed when a given test suite was run. There’s no judgements made to the quality of the tests, simply, how much code did they execute.

Where Code Coverage Gets Tricky

Just to reiterate, code coverage as a metric makes no claims about the quality of tests. If you write a “test” (intentionally in quotes), that simply calls a method and does nothing with the result, the method it calls will have a high level of coverage. That being said, the “test” has done nothing to actually verify an outcome, or craftily provide edge case inducing input. It simply calls the method and discards the result. Voilah, high coverage, crappy test. For example:

class Adder {
  func add(x: Int, y: Int) -> Int {
    return x + y
  }
}

Here’s a corresponding test:

func testAdd() {
  let toTest = Adder()
  toTest.add(2, y: 3)   
}

Adder right now has 100% unit test code coverage! Yay!

Wait a minute, slow down hoss. There’s not a single assertion made in that test. While the test generates a high code coverage metric, it doesn’t validate squat.

code coverage is a silver bullet

TDD FTW

This is where following your test driven development cycle of “Red, Green, Refactor” you’ll never get into this state of test crappiness, and it can truly ensure that your code coverage is a silver bullet. The “red” step of that cycle is critically important, as it ensures that your test actually verifies something. Without knowing that your test can actually fail, you never know that your test actually does anything. And likewise, that your code coverage even means anything.

Be a Professional

The biggest counter argument you will hear about measuring code coverage, is that it can be cheated. Of course it can be cheated! Software “professionals” don’t cheat though. Craftsmen don’t take shortcuts. My life was changed when I read “The Clean Coder” by Bob Martin. He talks about what it takes to be a “professional software engineer.” (He also advocates for 100% code coverage despite all other costs, but I have other opinions on that). It’s a sense of taking pride in your work. With this post, I just want to put this call to action out there, be a professional. Code coverage measurement is just another tool in your toolbox. Code coverage is a silver bullet, but only one that returns to you what you put into it. Crap in, crap out. Use it appropriately, know it’s shortcomings, and know where it shines. When properly used in conjunction with TDD it can powerfully help you continually improve over time. I’d love for you to try it out, and let me know how it works for you.

I was inspired to write this article from listening to episode 67 of “This Agile Life” podcast, where they reference this article, “Is Code Coverage a Silver Bullet?

Happy cleaning.