Swift Code Coverage: How to measure it

Yesterday, I talked about the merits of how code coverage can be used as a metric in your software development process. Measuring Swift code coverage in Xcode has never been easier. Apple provides a great overview in their WWDC 2015 session, “Continuous Integration and Code Coverage in Xcode”. Xcode 7 provides a integrated experience for tracking the coverage of your tests. You can literally start measuring the code coverage of your tests by clicking a single checkbox. And good news, the coverage also works for your KIF tests.

How To Turn On Code Coverage Measurement

Open your scheme editor by selecting Product -> Scheme -> Edit Scheme, or the keyboard shortcut Command-Shift-Comma.

Select Test in the left hand pane, and then check the box for Gather code coverage.

swift code coverage

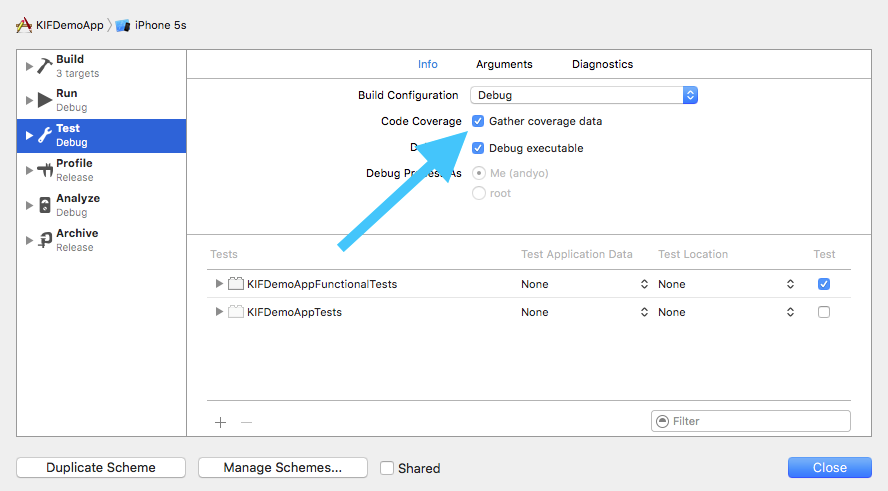
That’s it! On your next test run, Xcode will measure the Swift code coverage of your tests.

Viewing Swift Code Coverage Results

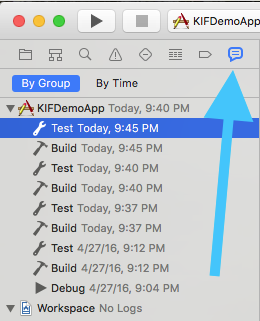
Viewing the results of how your tests fare with code coverage is just as easy. Run your tests, and then open the Report Navigator. You can open this by either selecting the thing that looks like a chat bubble in the left hand pane of Xcode, or select the menu Product->Scheme->Edit Scheme…, or use the keyboard shortcut Command-8. Then select your most recent Test run in the list.

swift code coverage

From there, in the center pane of Xcode, look for the Coverage tab.

swift code coverage

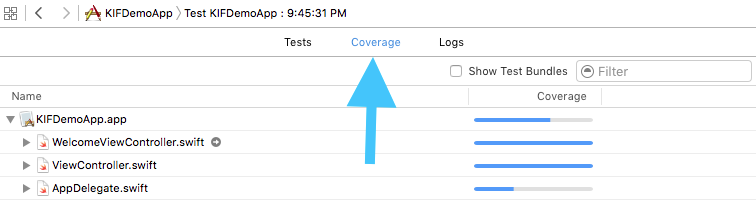
On the Coverage tab, you’ll see a list of your classes, and their methods, with bar charts indicating how much of their code is covered from your tests.

You can then even jump right to the corresponding code from the coverage viewer. Just double click either the class or method name. And what’s even cooler, is that Xcode will show you the number of times the line of code was executed in the right hand gutter of the editor.

Overlapping Test Types

Keep in mind, that depending on how your test targets are configured in the scheme, that the results you are looking at may be an aggregate of more than one type of test. For example, if you’ve created both unit and UI tests, and they each live in their own targets, but both targets are included in the Test action for the scheme, that the coverage numbers will be an aggregate of both types of tests. I’ll write a post later this week with a proposal on how you can separate these metrics (hint: it involves creating separate schemes for each type of tests).

Wrap Up

Measuring your Swift code coverage really is that easy. Normally code coverage is also tracked in actual numbers, and reviewed for trends over time. With Xcode alone, it doesn’t provide this. Xcode Server helps remediate the problem while providing specific measurement numbers and also allowing you to compare coverage numbers across different devices. Have fun with code coverage. When working in a team, it’s fun to watch code coverage change over time, hopefully for the better. I suggest that even as you code review your peers’ work, peak at how the code coverage for a given piece of code changes with their change. Does it go up? Does it go down? Remember, code coverage is just a metric that indicates whether a line of code was executed or not. It doesn’t speak at all to the quality of the test. Please be a professional, and professionals don’t write code without using test driven development.

Happy cleaning.

TDD in Xcode – Critical Keyboard Shortcuts

Iterations though the test driven development workflow must happen fast. In fact, fast is better than perfect. TDD in Xcode isn’t painful. In fact, there are a couple tips and tricks I’ve adopted when going through my red-green-refactor workflow in Xcode that makes it easy. I wanted to share them with you.

Assistant Editor FTW

When entering the TDD zone, the first thing you want to do is get both the “production” file and the corresponding test file open. Use the Assistant Editor for this. The bigger the monitor the better. Open both of these files at the same time, in windows next to each other.

It should look like this:

TDD in Xcode

I don’t really have a concrete preference as to which file, the test or the production class, should go on the left or the right. Just remember that if you set breakpoints, the debugger will bring the file with the breakpoint to focus in the lefthand pane.

It’s kind of cumbersome to click around in Xcode to get the Assistant Editor to do what you want, and in fact I’m not even sure that I know how! I’ve become so accustomed to using keyboard shortcuts to bend Xcode to my will!!! Here’s a shortcut that I couldn’t live without, it will open any file of your choosing in the Assistant Editor, side by side with whatever file is currently open.

  1. Command-Shift-o
  2. Option-Shift-Enter
  3. Right Arrow, Enter

Okay, so it’s really a sequence of commands. Stop complaining, it’s not that hard to learn, and TRUST ME, once you commit these to finger memory, you’ll find use for them beyond just your TDD flow.

The first command brings up the “Open Quickly” dialog where you can then type a filename (or a method or variable) to open. It looks like this:

TDD in Xcode

The second command selects the file to open, while at the same time allowing you to specify where it should be opened in Xcode. It looks like this:

TDD in Xcode

The third command is just the key combination to specify that the file should be opened side by side with the current window.

Here’s a clip showing the whole sequence together:

TDD in Xcode

Running Tests

There are two specific other keyboard shortcuts that are absolutely essential to when I’m working with TDD in Xcode:

  1. Command-Option-Control-U
  2. Command-Option-Control-G

There’s not even a succinct name for the first command, and maybe that speaks to it’s absolutely magical nature. First off, the command only works when the cursor is within focus of a test class. When you execute that command from a test case, it will run whatever tests that are in the same scope as the cursor. For example:

If the cursor is within a single test method, only that test method will be run. If the cursor is within a single test class, all tests in that class will be run, but only that class.

Speed it the key to successful TDD in Xcode. The less tests you execute at once, the faster execution will be (and the more you sacrifice in what’s actually validated). I absolutely love this keyboard shortcut, it totally enables me to make small changes to the test and the class under test throughout my TDD workflow, and quickly run the associated tests.

The second keyboard shortcut is a nice complement. It reruns the last test that was run. So if you cursor is bouncing around and it’s not focused in the appropriate context (like the cursor is within the class under test) to execute the first command, this is a nice alternative to rerun whatever the last test run was.

Command-U

Don’t forget to periodically run the entire test suite. This shortcut runs all tests associated with the Test configuration in the current Scheme. In the early stages of projects, this may be fast enough for you, and you may not even need to use the more specific test running shortcuts. Enough TDD though, and you’ll get to a point where executing all tests becomes frustratingly slow for getting that immediate feedback you need for successful TDD.

The Mouse, Available But Slow

TDD in Xcode

You can always use the mouse for executing tests as well, but don’t. I just want to point it out for thoroughness sake, as well as make the point that any point you need to take your fingers off your keyboard, you are slowing down. Resist the urge to move your hands over to the mouse. Learn the keyboard shortcuts! It will pay so many dividends in your quest towards TDD in Xcode enlightenment.

Anything Else?

What do you use in your TDD workflow that enables successful, high quality code?

Happy cleaning.